

For the first experiment, we will show you the experiments that we have done for the first week of our biochemistry laboratory class. We had done 2 simple experiments based on the acid and base concept. Scroll down for more experience..=)
Abstract
The purpose of this
study was to investigate the property of weak acid with pH changes and how to
prepare pH indicator by using natural indicator. In this study, there were
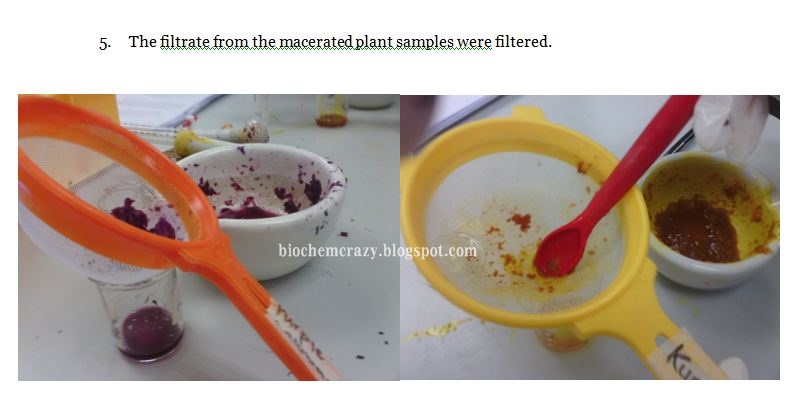
two types of weak acid that were used which are acetic acid and amino glicine
acid. The properties of these weak acids are determined by undergo titration
process and the pH value was recorded by pH meter. This study also involved the
determination of the pKa value by plotting a graph of pH versus volume of the
base. Based on the theory, the value of the pKa of acetic acid is 4.76 and for
the amino glicine acid are 2.53 (carboxylic) and 9.78 (amino). From this
investigation, we want to compare the value of pKa acetic acid and amino
glicine acid through the experiment with the theoretical value. Through this experiment, the making of pH
indicator also carried out by using two types of plants which are red cabbage and
turmeric. Red cabbage and turmeric had a pigment that can change their color of
extraction according to pH of the solution. In this experiment, we want to
compare which one is better as natural pH indicator. Red cabbage contains a
pigment molecule called flavin which is an anthocyanin. Anthocyanin can be used
as pH indicator because their color changes with pH which is pink in acid,
purple in neutral and greenish-yellow at basic. Besides that, turmeric also
contain an active ingredient which is called as curcumin. Curcumin is a pH
indicator which is in acidic solution (pH<7.4) it turns to yellow, whereas
in basic solution (pH> 8.6) it turns to bright red.
1. Acid Base Titration
Introduction.
1. Weak acid is different from the strong acid because it cannot dissociate completely in water.
2. Acetic acid and organic acid are weak acid and they can be partially dissociated.
3.Thus, only small amount of weak acid molecules dissociated compared to strong acid which exists as H+ and A- in a solution.
4. This causes weak acid to depends on the coefficient of equilibrium.
Our objectives for this experiment are:
1. To observe the property of weak acid with pH changes
2. To learn how to use the pH meter correctly
3. To learn how to prepare buffer system
4. To experience how to titrate acid-base
Below are the materials and methods that we used in this experiment.
Materials:
1. 0.1M acetic acid
2. 0.1M phosphoric acid
3. 0.1M amino glycine acid
4. 0.1M NaOH
5. Calibrated pH meter
 |
| Calibrated pH meter |
Methods:
1. 0.1M NaOH was fill in a burette
2. 25ml of 2 acids separately was titrated with NaOH
3. The pH value was measured by using the pH meter every time we add 1ml of NaOH
4. All the findings where recorded
 |
| The titration apparatus |
What we get for glycine acid was.....
 |
| Table 1. Volume of NaOH used and the pH values recorded |
 |
| Graf 1. pH Versus Volume of base (NaOH) |
What we had discussed from the above results are:
- The pH will rise normally but as reaches the one where at some point the solution seems to be buffered and the slope will level out.
- The buffering stageof glycine acid is at pH 9.68 where the readings been noted 2 times for the same reading. Means that at pH 9.68, the curve is straight for a few times.
- After that the pH reading rises sharply at pH 10.14 through its equivalence point and it level out again at pH 10.24.
- There are another 2 buffering stage that we found which are at pH 12.38 and 12.48. For overall pH reading for glycine , it shows small pH changes. This is because glycine can be categorized as weak acid.
- To prepare buffer solution, its concentration must be sufficient and when the pH of the solution is close or within about one pH to its pKa .
- There are 2 situations that we must pay attention during preparation of buffer solution :
- First, if the pH expected to decrease during the experiment, the buffer chosen is needed to be slightly below the working pH
- It is vice versa when it’s come to the increasing of pH during the experiment.
And...what we get for acetic acid was.....
Data collected during titration

Table 2. Volume of NaOH used and the pH values recorded
Transform it into line graph

Graf 2. pH versus Volume of base (NaOH)
What we had discussed from the above results are:
- The beginning pH of the acid solution, before the addition of the base is counted to be the concentration of H+ in the solution (acetic acid = pH 3.46).
- Once titration start, some of the NaOH has been converted into its conjugate base to form OH-. Based on Henderson- Hasselbalch equation, this region is known as buffer region.
- As base is added to the acid in this buffer region, acetic acid reacts with it ro form acetate ion, without a large change in pH.
- The curve changes direction (inflects) at the pH 4.74 after 12ml of NaOH added. The pH at this inflection point is equal to the pKa of acetic acid. (listed pKa = 4.76)
- The titration experiment is valuable because it reveals the pKa value as well as the ionic forms of acetic acid present at various pH values.
- The inflection point is important because here, one-half of the original acid has undergone dissociation so equal amounts of two forms of acetic acid are present: the undissociated form of CH3COOH (50%) and the conjugate base form CH3COO- (50%).
- Equivalence point is reached when the amount of NaOH added equivalent to the amount of acid present to begin with, corresponds to the complete conversion of NaOH to OH-
- Past the equivalence point, further adding hydroxide making pH calculation in this region would be used for a strong base.
- Acetic acid is relatively weak acid (there is only slight dissociation = monoprotic acid) so most acetic acid just prior to titration are in the form of CH3COOH.
Titration in progress

2. Application: Making pH indicator
Introduction
- Extraction of natural indicators from common flowers, fruits and vegetables can be used as natural indicators.
- In this experiment, we have made some indicators solutions and papers which can indicate both an acid and a base.
- The test papers only works when it is wet with distilled water.
- We also had made our own scale by using red cabbage and tumeric.
How?????
At first, let us show you the apparatus and the procedure that we had used.....
Materials:
- 0.1 M HCl solution
- 0.1 M NaOH solution
- 2- propanol (isopropyl alcohol)/acetone/distilled water
- Red cabbage and turmeric


Step
2 : Testing the pH range of the indicator
- 13 test tubes were labeled from 1 to 13
- 9.0 mL of distilled water was placed in all test tubes except test tube 1 and 13
- Solutions in the acid range were prepared in the following manner:
- 10 mL of 0.1 M HCl was placed in test tube #1 (pH=1)
- 1.0 mL of 0.1 M acid from test tube #1 was transferred to the test tube#2 and mixed vigorously.
- The making of the serial dilutions was continued by transferring 1.0 mL of the most recently diluted acid solution to the next test tube until six acid solutions of pH 1 to pH 6 were prepared. Each serial solutions were mixed thoroughly before the transfer.
5.The solutions of the base was prepared in the following manner:
a. 10.0 mL of 0.1M NaOH was placed in test
tube #13 (pH13)
b.
1.0mL of 0.1 NaOH from test tube #13 was
transferred to test tube #12 and mixed thoroughly. (pH=12)
c. The making of the
serial dilutions was continued by transferring 1.0mL of the most recently
diluted basic solution to the next test tube and mixing thoroughly each time
before the transfer.

6. The wells of a spot plate from 1 to 13
were labeled. A few drops of each solution prepared in steps
3,4 and 5 were transferred to the corresponding well in the spot plate.
7. A drop or two of the red cabbage and turmeric extract indicator were added to each well. The pH at which the indicator changes color was observed.
3,4 and 5 were transferred to the corresponding well in the spot plate.
7. A drop or two of the red cabbage and turmeric extract indicator were added to each well. The pH at which the indicator changes color was observed.
 |
| Color changes of red cabbage due to different pH |
 |
| Color changes of tumeric due to different pH |
Step
3: Testing the pH of other liquids
1.
When pH ranges of the indicators have
been determined, they were used to test the pH of household chemicals.
Results:
a)
pH range of red cabbage and turmeric

a) pH
of household chemicals after tested with red cabbage indicator and turmeric
indicator.


 |
- We can also made our own litmus paper by using filter paper which had been dipped into the red cabbage and tumeric. Do you want to know how does it looks like when we dip the new 'litmus paper' into the household chemicals????? Lets chek it out!!!

Thus, can you guest the pH range of the household chemicals????

- Instead using chemical indicator for example phenolphthalein, we also can use natural indicator to detect acid and base.
- But, there are some limitation when using natural indicator because some of the plants only can indicate specific just one but some of them can detect both acid and base.
- From the result obtained, we can saw that, the red cabbage is a good natural indicator compared to the turmeric.
- This is because, the red cabbage can give different color of solution when tested on different solution of acid and base while turmeric only gave same color result except the different appearance when tested at strong base solution.
- Red cabbage is better indicator than turmeric because red cabbage contains a pigment molecule called flavin which is an anthocyanin. When this indicator tested into the acidic solution, it will turn to a red color.
- For the neutral solutions, it will result in a purplish or violet color and for when tested to the basic solution it will appear in greenish-yellow.
- Meanwhile, turmeric contains curcumin which is the active substance of turmeric.
- Curcumin is a pH indicator that turns to yellow in acidic solution whereas in basic solutions it will turn to bright red.
From these acid and base experiment, we had conclude that;
- Each acid has different graph for titration depends on their presence of acidic (ionizable) hydrogen (proton) which classifies acid into two types either monoprotic or polyprotic acid.
- Monoprotic acid is an acid with only single hydrogen atom that can dissociated per molecule and polyprotic acids contain more than one hydrogen atom that can be dissociated per molecules.
- The red cabbage show a better result as pH indicator compared to the turmeric.
- We can used flowers, fruits and vegetables as pH indicators instead of using phenopthalein or universal indicator.
References:
3. http://en.wikipedia.org/wiki/Turmeric
No comments:
Post a Comment