Wednesday, 8 May 2013

FUN EXPERIMENT 3 : Enzyme


INTRODUCTION

 Enzymes are the catalysts of biological system and are extremely efficient and specific as a catalyst. Compared the acceleration the rate of reaction by factors with the absent of enzyme, a reaction can be speed up at least a million times with the presence of enzyme with the same reactions. Enzymes are highly specific and only particular enzyme catalyses only a single chemical reaction or a set of closely related chemical reactions.

Enzyme kinetics is study of the rates of enzyme-catalysed reactions. It’s principally concerned with the measurement and mathematical description of this reaction rate and its associated constants. To investigate the enzyme rates, Michaelis-Menten equation (MM) is used. In this experiment, in order to discuss properties of an enzyme (amylase), certain values are determined experimentally under steady state conditions. These values are determined by using formula for kinetics studies that include;


Vmax : The so-called maximal rate of the catalysed reaction. The enzyme's active site is    
           saturated.

Km : The Michaelis constant. The substrate concentration at which the reaction rate is one 
          half of its maximum value or also known as the turn over number. 


These values are determined experimentally by recording the progress of an enzyme-catalysed reaction using fixed amount of enzyme and a series of different factors such as temperature, pH and substrate concentration are test. These values used to construct a graph that presenting the reaction rate occur. Different graph assemble different reaction occur such as enzyme inhibition that act in varies of ways that affect their kinetic effect.


ABSTRACT


The purpose of this experiment conduct was to determine the effect of substrate concentration, temperature and pH on enzyme activity. In this experiment we want to evaluate absorbance and the reaction rate of enzyme amylase in starch-iodine solution. The enzyme activity was measured through its absorption rate in the spectrophotometer with a wavelenght of 590 nm. To measure the result of each effects, we had plotted one standard reference graph from a 9 standard solution of starch (0, 0.01, 0.025, 0.05, 0.1, 0.3, 0.5, 0.7 and 1.0 mg/ml) as a So. To test the effect of substrate concentration in enzyme activity, each standard solution was prepared in different concentration of water and amylase. Then, through the testing the enzyme at different temperatures and pH levels, it would determine at which temperature and pH level the enzyme worked the most efficiently. To test the optimal pH, the starch and a buffer were combined at a specific pH level and each sample was incubated for 10 minutes. For temperature, we used three different temperature of (8, 28, 40ºC) to determine the rate reaction of enzyme. Then, the solution was tested in spectrophotometer of 590 nm. Specific graphs were drawn to determine at which substrate concentration, pH and temperature was the optimum for the enzyme after the experiment. Through our result that we obtained,  the enzyme amylase worked more efficiently under the pH level of 6 and 7.  Michaelis- Menten kinetic theory proved that there is the relationship of substrate concentration to the reaction of the velocity.The lower the value of Km, the higher the affinity of the enzyme for enzyme substrate complex formation. For temperature, Enzyme reacts optimally at Vmax  0.01 where the affinity of the substrate is higher while the Km  is lower, 0.005. However, since the whole testing experimental was taken only once, we cannot state that the results were precisely accurate


MATERIALS:

  • Test tube
  • Amylase
  • Iodine
  • Distilled water
  • Waterbath
  • Ice
  • Spectrophotometer


PROCEDURES:

          A)   Preparation of standard reference
  •     Starch solutions were prepared from the stock solution (1.0 mg/ml) into dilutions of 0.01, 0.025, 0.05, 0.1, 0.3, 0.5, 0.7, and 1.0 mg/ml from the starch stock solution.
  •      Iodine solution is prepared by adding 5 g potassium iodide to 100 ml water. The dissolved potassium iodide is added with 1 g of iodine and is allowed to dissolve.
  •      A standard curve of Absorbance (@ 590 nm) vs Concentration of a starch/iodine mixture was prepared. 


      B)   The effect of substrate concentration.
  •     Standard starch solution was prepared into dilutions of 0.01, 0.025, 0.05,0.1, 0.3,0.5,0.7 and 1.0 mg/ml from the starch stock solution.
  •     The starch hydrolysis in different substrate concentration was prepared as the table below.


  • Starch concentration was calculated after each sample undergoes hydrolysis by using standard curve. Starch concentration was calculated by using initial starch concentration and final starch concentration, [S]= (So) – (Sf)
  • The velocity was calculated as V= ∆S/∆ t = (S0 – Sf) / 10 minutes
  • By using the data collected, a Michaelis-Menten graph was plotted.
  • The value of Vmax and Michelis constant Km were stated.


          C)   The Effect of Temperature  
  •      The following table below is uses as guide in an experiment the effect of temperature on enzyme.
  •     The Lineweaver-Burke line was plotted for the result of 20, 28, 35 and 40°C.
  •     All three plots in Lineweaver-Burke line were being compared.
  •     In the Lineweaver-Burke line, the values of Vmax and Km for all plots were find.

       D)   The effect of pH

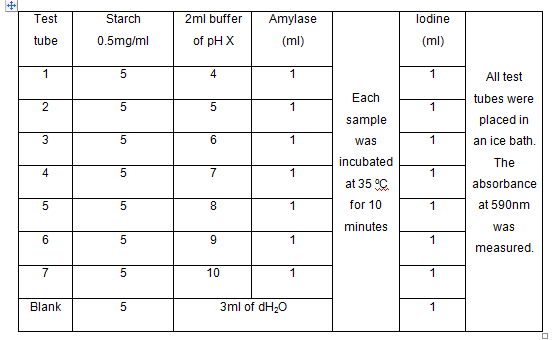
  •     The following table below is uses as guide in an experiment the effect of pH on enzyme


  •     The values of V for all pH were stated.
  •     The velocity for each pH test was compared. 


         RESULT AND DISCUSSION:


         A) Standard Graph 


B) The effect of Substrate Concentration


·  Michaelis-Menten graph is a graph that shows the relationship between the concentrations of a substrate and the rate of the corresponding enzyme controlled reaction. Michaelis-Menten kinetic theory of enzyme action state that enzyme concentration and substrate concentration give effect on the velocity reaction. The effect of enzyme concentration on reaction velocity means that if the substrate concentration is held constant, the velocity of the reaction is proportional to the enzyme concentration.
·      In this experiment, we are focusing on the second kinetic theory of enzyme action which is the effect of substrate concentration on reaction velocity. There are two orders that present in the Michaelis-Menten graph which are first order and zero order. When the substrate concentration is low, the reaction velocity is first order with respect to the substrate means that the reaction of velocity is proportional to the substrate concentration. But, when the substrate concentration becomes higher, the reaction velocity is zero order means that velocity is independent of substrate concentration. At middle of substrate concentration, the proportional of the reaction is changing.
·         There are two parameters that involve in the Michaelis-Menten graph which is Vmax and Km. Vmax is the maximum rate at which the enzyme can catalyze the reaction while Km or Micahelis constant is the substrate concentration at half Vmax. From the results, the maximum velocity is 0.062 and half Vmax is 0.031. Then, Km was obtained from the graph at half Vmax and the value is 0.24. The Michaelis constant,Km provide a measure of the affinity of an enzyme for its substrate. The lower the value of Km, the higher the affinity of the enzyme for enzyme substrate complex formation.

C) The effect of temperature


  •    For this experiment, we study about the relationship of activity of enzyme and temperature. Before explaining the graph, we should explain to you about the Vmax and Km that related to the enzyme activity calculations.  Vmax refers to the velocity maximum that the enzyme can reach when certain temperature apply to a reaction, whereas, Kis Michealis constant, which shows us the affinity of an enzyme in a reaction. The lower Kreadings the higher affinity of the enzyme
  •    In the calculation above, we can see that Vmax for temperature is 0.05. In a reaction the higher velocity the higher rate of reaction. This is because more collisions occur in between enzyme and substrate. As the temperature rises, molecular motion and hence collisions between enzyme and substrate speed up. But as enzymes are proteins, there is an upper limit beyond which the enzyme becomes denatured and ineffective. 
  • Km for 8oC is 0.42 , for 28oC is 0.4 whereas, for 40oC is 0.3. The type of inhibitor of the reaction is known as competitive inhibitor.
  •  The Km value is lower indicates that the enzyme have the higher affinity to react.
    
            D) The Effect of pH


·  Based on the result obtained in Table 4, we can see that the highest velocity of the enzyme reaction is at pH 6 and pH 7 which is 0.045 V. The velocity increased rapidly from pH 5 to pH 6 at 0.003 V.
·    Based on Table 4, it shows that amylase used in this experiment is highly active at pH 6 to pH 7. This can be shown by the static amount of velocity at both pH values. The velocity decreased rapidly from pH 8 to pH 10. This shows that the enzyme cannot react in those pHs. Thus, this shows that the enzyme can react actively at pH below 7.
·  In the theory, it was stated that there are three types of amylase enzyme. The α-Amylase, β-Amylase, γ-Amylase enzyme.
·    Each types of amylase active optimally at different pH.  The α-Amylase react optimally at pH 6.7 to 7. The optimum pH for , β-Amylase is pH 4.0 to 5.0.  While γ-Amylase optimally at pH 3.
·  From the result shown in Table 4, the enzyme reacts actively at pH 6 and pH 7. Therefore, it is predicted that alpha amylase was used in this experiment.
·     While conducting the experiment, there are few error causes us failed to obtained the exact result. One of the major errors occurs is the using of dropper instead of micropipette. The function of the micropipette is to measure a small reading of volume needed. In this experiment, the smallest volume used is 1 mL. We used the dropper to measure and sometimes parallax error might occur during the measurements thus giving the wrong reading for the volumes. Error in volume of concentration might give the error for the absorbance reading. Thus it might affect the result for the enzyme activity.
·   During taken the measurement for the pH, we also used the same of dropper and measuring cylinder. We might rinse both of dropper and micropipette with not proper ways. This might contaminate the others pH value. 


CONCLUSION:

From these enzyme experiment, we can conclude that,
  •   In a nutshell, Michaelis- Menten kinetic theory proved that there is the relationship of substrate concentration to the reaction of the velocity.
  •       Enzyme reacts optimally at Vmax is 0.01. The affinity of the substrate is higher as the Kis lower which is 0.005.
  •      The enzyme, amylase reacts actively at pH 6 and pH 7.


REFERENCES:

·     Donald B.Sittman, Victor L. Davidson (1999). BIOCHEMISTRY 4TH EDITION.  Philadelphia : Lippincott-Raven Publisher.
·         http://en.wikipedia.org/wiki/Enzyme
·         http://users.rcn.com/jkimball.ma.ultranet/BiologyPages/E/EnzymeKinetics.html
·         https://en.wikipedia.org/wiki/Velocity
·         http://en.wikipedia.org/wiki/Amylase


Monday, 8 April 2013

FUN EXP 2: Protein Assay


ABSTRACT

For this experiment, we shows to you about the protein content in the egg by using two different tests which are Lowry assay and Biuret reagent. The type of egg that we study are Telur Ayam Biasa, Telur Ayam Kampung, Telur Itik, Telur Puyuh and Telur Omega 3.Before that, we need to identify the standard concentration foe each indicator which are Lowry and Biuret reagent. After plotting into the graph, we can conclude that for Lowry reagent, the highest concentration of protein is Ayam Biasa which is 0.6 mg/L, followed by Telur Ayam Kampung 0.56mg/L , Telur Itik 0.54 mg/L , Puyuh 0.5 mg/L and Omega3  0.41 mg/L. For Biuret reagent, Telur Omega3 have the highest protein content which is 6.0 mg/L followed by Telur Ayam Kampung 2.60mg/L , Telur puyuh 2.35 mg/L, Telur Itik 2.25mg/L and telur Ayam biasa is 1.4 mg/L. 


Introduction:

            The determination of protein concentration is an essential technique in all aspects of protein studies. Each protein assay method has its own advantages and limitations and often it is necessary to obtain more than one type of protein assay for study. Protein assays based on these methods are divided into two categories: dye binding protein assays and protein assays based on alkaline copper.

            In this experiment we investigate the protein assay based on alkaline copper which is Biuret Assay and Lowry Assay. For Biuret assay, the reaction of protein with the copper ions at a basic pH to become complex is observed. When this reaction is used to measure protein concentrations, it is called the Biuret Protein Assay. The copper ions will complex with the amide groups in the proteins to create a blue color that will be measured using a spectrophotometer. The amount of blue color that forms is directly proportional to the quantity of protein in our samples. The interaction of cupric ions (Cu2+) with protein results in a blue color that can be read at 545nm.

        For the Lowry assay, under alkaline conditions cooper ions react with peptide bond resulting in reduction of cupric ions (Cu2+) to cuprous ion (Cu+). The Cuprous ions can be detected by of the Folin-Ciocalteay reagent (phosphomolybdic/phosphotungstic acid). The amount of color produced is proportional to the amount of peptide bonds. Cuprous ions (Cu+) reduction of Folin Ciocalteu Reagent produces a dark color that can be read at 650-750nm.  This experiment will demonstrate the Biuret assay for proteins concentration determination at absorbance 540 nm while Lowry assay at absorbance 750nm. 


BIURET REAGENT

Apparatus and materials:
  • ·         Test tubes
  • ·         Cuvettes and spectrophotometer
  • ·         Pipette
  • ·         Biuret reagent
  • ·         Proteins sample


Procedures :


The solutions of gelatin was prepared at 1,2,3,4,5 and 6 mg/ml in water for Biuret assay.


0.50 ml of protein was mixed with 2.50ml of Biuret reagent.


The absorbance of the standard Biuret reagent was measured after 10 minutes by using spectrophotometer.


The reading of the absorbance was recorded and a standard curve was plotted.


0.1ml of pure protein samples which are consists of telur itik,telur puyuh,telur ayam biasa,telur ayam kampung and telur omega was diluted with 19.9ml of distilled water.


0.50 ml from each of protein samples were mixed with 2.50ml of Biuret reagent and left for about 10 minutes.

                                                                             
After 10 minutes, the reading of all samples were measured by using spectrophotometer and recorded in the table provided.


The standard curve for the protein samples was plotted and the standard solution for each of the samples was determined.


The concentration of each proteins sample were compared by using both method.


Results :

     Standard solution of Biuret assay (mg/mL)

      Absorbance of 1mL at 540 nm
     1   
      0.134 nm
     2
      0.164 nm
     3
      0.199 nm
       4                                                                   
      0.278 nm
    5
      0.269 nm
    6
      0.356 nm

  Table 1: The absorbance of 1mL of standard solution of Biuret assay at 540 nm.

      Protein sample
     Absorbance of 1mL at 540 nm
      Telur itik
      0.180 nm
      Telur puyuh
      0.182 nm
      Telur ayam biasa
      0.137 nm
      Telur ayam kampung
      0.195 nm
      Telur omega
     0.356 nm

Table 2: The absorbance of 1mL of protein sample at 540 nm


Dicussion :

From the graph that we had plotted, we can found that the standard solution of Biuret assay of the proteins sample :
a)      Standard solutions of Biuret assay for telur itik is 2.25 mg/ml x 400
b)      Standard solutions of Biuret assay for telur puyuh is 2.35 mg/ml x 200
c)      Standard solutions of Biuret assay for telur ayam biasa is 1.4 mg/ml x 200
d)     Standard solutions of Biuret assay for telur ayam kampung is 2.60 mg/ml x 200
e)      Standard solutions of Biuret assay for telur omega is 6.0 mg/ml x 10


LOWRY REAGENT

Procedure:

  1.     0.25 mL of protein is mixed with 2.5 mL of Lowry reagent.
  2.     After 10 minutes, 0.25 mL of Lowry reagent 2 added and mixed well immediately.
  3.     After 30 minutes, the absorbance at 750 nm is measured and standard curve is plotted.
Lowry reagent 1:
1.       One volume of reagent B is mixed (0.5% copper sulfate pentahydrate, 1% sodium of potassium tartrate) with 50 volumes of reagent A (2 % sodium carbonate, 0.4% NaOH). Bothe reagent A and B are supposed to be stable for a long time)
Lowry reagent 2:
1.       Commercial Folin- Ciocalteu reagent is diluted with an equal volume of water. Its stable for a few days or weeks.
All series should include a zero protein (water) tube (reagent blank) 


Result:

S      Standard
         Concentration (mg/mL)
                                          Absorbance (750 nm)
      Blank
      Standard
      0.1
      0.130
     0.271
     0.2
      0.125
     0.160
     0.3
     0.125
     0.178
     0.4
     0.127
     0.217
     0.5
     0.125
     0.204
     0.6
     0.124
     0.296

         Unknown Concentration
     Unkonwn Concentration (mg/mL)
                              Absorbance (750 nm)
       Blank
        Protein
      Telur ayam kampung
      0.118
     0.280
      Telur ayam biasa
     0.122
     0.296
      Telur itik
     0.122
     0.271
     Telur puyuh
     0.124
     0.262
     Telur omega 3
     0.127
     0.222


         Discussions:

        Lowry assay

        Biochemical assay for determining the total level of protein in a solution. Oliver H. Lowry is the person who create the reagent responsible for protein level determination.
  This method was prepared under alkaline conditions. The divalent copper ions will forms a complex with peptide bonds in which it is reduced to a monovalent ion.


This means that the aromatic amino acids in the treated sample reduce the phosphomolybdatephosphotungstic acid present in the Folin Reagent (Folin-Ciocalteu phenol reagent in Lowry reagent 2). Thus, this may result in the blue color of the solution.

  1. From the experiment, with referring to the standard that we have done, we can see that “telur ayam kampung” shows 0.280nm which is near to the absorbance of 0.6 mg/mL concentration of the standard.
  2. Meanwhile “telur ayam biasa” has 0.296nm absorbance, which shows the same absorbance reading of the 0.6mg/mL concentration standard.
  3. Most of the eggs showed absorbance reading near to 0.296nm which means that they may contain 0.6 mg/mL protein. Meanwhile the duck egg shows that it only have 0.1 mg/mL protein by comparing its absorbance and the standard.
  4. The Lowry method very sensitive to a lower concentration of protein down to about 0.01 mg/mL. This method is best used on solutions with concentration in the range 0.01-1.0mg/mL of protein.
  5. Lowry method has a disadvantage. It only accurate when the protein is free from non-protein agents such as buffers, drugs, nucleic acids and sugars. That is why we need to dilute them so that the agents can be minimized in assuming that the protein concentration is sufficiently high and can be detected after the dilution.
    Thus, when the interfering agent are involve, we need to run appropriate blank. Appropriate blank is the cuvette without a standard protein which is made up in the same agent as in the sample. This way, if the agent has an effect on the protein assay reagent, each sample and the blank will have been altered the same. The blank is used to set the instrument to the zero absorbance.

  1. Other three alternative methods of determining protein concentration is by using Enzyme-linked immunobsorbent assay (ELISA), the Bicinchonicic Acid (BCA) assay and Protein 200 plus assay
  2. ELISA - involves the immobilization of the antigen/protein of interest. There are two  types of ELISA assay; direct and indirect. The direct ELISA assay is faster compared to indirect ELISA assay and eliminates the problems of cross-reactivity of secondary antibody.
  3. BCA assay - similar to Biuret reagent and Lowry protein assay. It can determine total concentration of protein range in 0.5 µg/mL to 1.5 mg/mL.. This method can be applied in higher temperature  (37-60 oC) to increase the assay sensitivity while minimizing the variances caused by unequal amino acid composition.
  4. Protein 200 plus assay- The chip-based were performed on the Agilent 2100 bioanalyzer in combination of Protein 200 Plus LabChip kit. All chips prepared according to the protocol provided with the 200 Plus LabChip kit. The Agilent 2100 bioanalyzer in combination with the Protein 200 Plus LabChip kit and the absolute quantification feature of the sowftware provides fast and reliable accurate data.
     Conclusion:
      In conclusion, the biuret and lowry reagent can be used to determine the protein content in the egg. The higher concentration of protein is been found in Omega 3 egg.

     References: